Finding anomalous events with OpenTelemetry and Azure OpenAI
One of the awesome things you can do with Azure OpenAI is generate embeddings. If you POST some text to the embeddings API endpoint, it’ll return a vector (a list of floating-point numbers) that represents the “meaning” of the text in a multidimensional space. Each of these dimensions represents a relationship or feature within the text. By computing the distance between two embedding vectors, using a measure like cosine similarity or Euclidean distance, you can compare their ‘relatedness’. The shorter the distance, the more closely related the text.
You can imagine a few use-cases for this, but something I’d like to explore is if we can use embeddings to detect anomalies in system and user behaviour, by comparing the distance between embeddings generated for OpenTelemetry traces. Traces with a short distances would indicate normal behaviour, and traces with higher distances would indicate anomalous behaviour.
When we think of anomaly detection in observability, we typically think of machine learning algorithms that learn the trends for a given set of metrics, and then alert when the metric deviates from those trends. Our approach is similar, we’ll take a set of traces that represent normal behaviour to use as our baseline, then we’ll run experiments to insert anomalies into the system, and see how the distances between the anomalous and baseline traces compare.
Disclaimer: I’m not a data scientist and have no formal training in statistics, if there’s a better way of analysing the data please let me know!
Generating Test Data
Our test system is a simple distributed system involving three microservices instrumented with OpenTelemetry, using Tempo as the backend for storing traces. We’ve got a python test script that simulates two users calling our WeatherAPI 500 times in total, and then downloads the trace for each request by querying the Tempo API. Each trace is saved on disk in protobuf format so we can analyse them later.
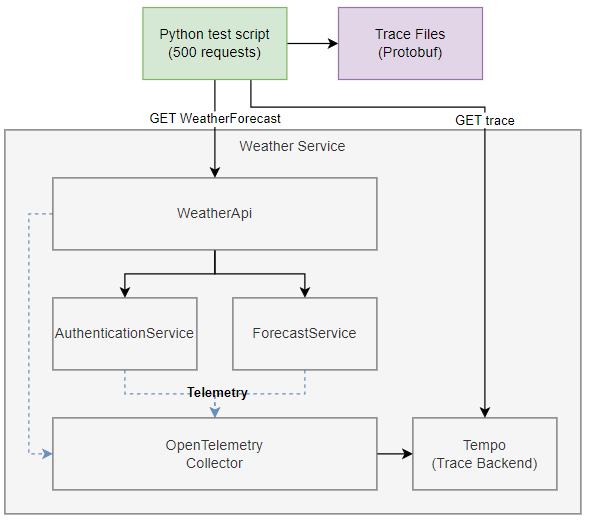
To make the system more closely resemble a real system, with all it’s aches and pains, we’ve added some artificial latency and bugs that cause exceptions. This “background noise” will be present in the baseline data so we can see how well our approach works in the real world, where the baseline isn’t perfect.
Some important information:
- Our two users are based in the UK and Singapore, identified on spans via the
user.countrytag. - Forecast temperature is randomly generated within a range specific to each country.
- Forecast temperature is added as a
forecast.temperatureCtag to theForecastServicespans. - There’s a bug in the
ForecastService, causing aKeyNotFoundexception to be thrown if the forecast temperature is above 38 degrees C.- ~5% of total requests are affected.
- Request latency for the
ForecastServicehas baked in “jitter”:- UK latency is random between 0 and 100ms.
- Everywhere else is random between 0 and 1000ms.
We’ll run our python test script multiple times to generate four datasets:
- Baseline: No anomalies.
- Anomaly: New user in Brazil, identified in the traces by the
user.countrytag (1/3 of all requests). - Anomaly: High latency for UK requests to the
ForecastService. The random latency range is increased from 0-100ms to 0-1000ms. - Anomaly: New exception type being thrown for 10% of all requests to the
ForecastService.
Generating Embeddings
In the first stage of our anomaly detection system, we generate embeddings for each of our traces and store them, along with some labels, into a vector database (qdrant). We’ll repeat this step for each of our datasets, storing the resulting embeddings in different collections (think tables) within the database. Here’s the general flow for each data set:

You may have noticed we convert the traces to a custom JSON format before generating the embeddings, there are three primary reasons for this. First, we generate embeddings on text data, and protobuf is a binary data format. Second, whilst OpenTelemetry has its own JSON schema for traces, it’s fairly verbose which increases costs. It’s also tailored for representing spans from multiple traces, so the structure of the JSON does not represent the flow of operations through our system. Finally, we want to remove any attributes that are random by nature that we don’t want to contribute to our anomaly scoring, such as trace_id and span_id. Here’s an example trace converted to our JSON format:
{
  "operation_name": "GET WeatherForecast",
  "client_or_server": "server",
  "duration_ms": 704.4421,
  "service_name": "WeatherApi",
  "service_version": "1.0.0.0",
  "attributes": {
    "server.address": "localhost",
    "server.port": 8080,
    "http.request.method": "GET",
    "url.scheme": "https",
    "url.path": "/WeatherForecast",
    "network.protocol.version": "1.1",
    "user_agent.original": "Python/3.11 aiohttp/3.9.3",
    "user.country": "Singapore",
    "error.type": "System.Net.Http.HttpRequestException",
    "http.route": "WeatherForecast",
    "http.response.status_code": 500,
    "operation.name": "microsoft.aspnetcore.server"
  },
  "events": [
    {
      "type": "exception",
      "attributes": {
        "exception.type": "System.Net.Http.HttpRequestException",
        "exception.stacktrace": "System.Net.Http.HttpRequestException: Response status code does not indicate success: 500 (Internal Server Error).\\n   at System.Net.Http.HttpResponseMessage.EnsureSuccessStatusCode()\\n   at WeatherApi.ForecastClient.GetForecastForUser(User user) in C:\\\\Users\\\\Blake\\\\source\\\\repos\\\\OpenTelemetry-Demo\\\\src\\\\WeatherApi\\\\ForecastClient.cs:line 21\\n   at WeatherApi.Controllers.WeatherForecastController.Get() in C:\\\\Users\\\\Blake\\\\source\\\\repos\\\\OpenTelemetry-Demo\\\\src\\\\WeatherApi\\\\Controllers\\\\WeatherForecastController.cs:line 21\\n   at lambda_method67(Closure, Object)\\n   at Microsoft.AspNetCore.Mvc.Infrastructure.ActionMethodExecutor.AwaitableObjectResultExecutor.Execute(ActionContext actionContext, IActionResultTypeMapper mapper, ObjectMethodExecutor executor, Object controller, Object[] arguments)\\n   at Microsoft.AspNetCore.Mvc.Infrastructure.ControllerActionInvoker.<InvokeActionMethodAsync>g__Logged|12_1(ControllerActionInvoker invoker)\\n   at Microsoft.AspNetCore.Mvc.Infrastructure.ControllerActionInvoker.<InvokeNextActionFilterAsync>g__Awaited|10_0(ControllerActionInvoker invoker, Task lastTask, State next, Scope scope, Object state, Boolean isCompleted)\\n   at Microsoft.AspNetCore.Mvc.Infrastructure.ControllerActionInvoker.Rethrow(ActionExecutedContextSealed context)\\n   at Microsoft.AspNetCore.Mvc.Infrastructure.ControllerActionInvoker.Next(State& next, Scope& scope, Object& state, Boolean& isCompleted)\\n   at Microsoft.AspNetCore.Mvc.Infrastructure.ControllerActionInvoker.<InvokeInnerFilterAsync>g__Awaited|13_0(ControllerActionInvoker invoker, Task lastTask, State next, Scope scope, Object state, Boolean isCompleted)\\n   at Microsoft.AspNetCore.Mvc.Infrastructure.ResourceInvoker.<InvokeFilterPipelineAsync>g__Awaited|20_0(ResourceInvoker invoker, Task lastTask, State next, Scope scope, Object state, Boolean isCompleted)\\n   at Microsoft.AspNetCore.Mvc.Infrastructure.ResourceInvoker.<InvokeAsync>g__Logged|17_1(ResourceInvoker invoker)\\n   at Microsoft.AspNetCore.Mvc.Infrastructure.ResourceInvoker.<InvokeAsync>g__Logged|17_1(ResourceInvoker invoker)\\n   at Microsoft.AspNetCore.Authorization.AuthorizationMiddleware.Invoke(HttpContext context)\\n   at Swashbuckle.AspNetCore.SwaggerUI.SwaggerUIMiddleware.Invoke(HttpContext httpContext)\\n   at Swashbuckle.AspNetCore.Swagger.SwaggerMiddleware.Invoke(HttpContext httpContext, ISwaggerProvider swaggerProvider)\\n   at Microsoft.AspNetCore.Builder.UseMiddlewareExtensions.InterfaceMiddlewareBinder.<>c__DisplayClass2_0.<<CreateMiddleware>b__0>d.MoveNext()\\n--- End of stack trace from previous location ---\\n   at Microsoft.AspNetCore.Authentication.AuthenticationMiddleware.Invoke(HttpContext context)\\n   at Microsoft.AspNetCore.Diagnostics.DeveloperExceptionPageMiddlewareImpl.Invoke(HttpContext context)",
        "exception.message": "Response status code does not indicate success: 500 (Internal Server Error)."
      }
    }
  ],
  "child_spans": [
    {
      "operation_name": "POST",
      "client_or_server": "client",
      "duration_ms": 106.3673,
      "service_name": "WeatherApi",
      "service_version": "1.0.0.0",
      "attributes": {
        "http.request.method": "POST",
        "server.address": "authenticationservice",
        "url.full": "https://authenticationservice/authentication/authenticate",
        "network.protocol.version": "1.1",
        "http.response.status_code": 200,
        "operation.name": "system.net.http.client"
      },
      "events": [],
      "child_spans": []
    },
    {
      "operation_name": "GET",
      "client_or_server": "client",
      "duration_ms": 593.4128,
      "service_name": "WeatherApi",
      "service_version": "1.0.0.0",
      "attributes": {
        "http.request.method": "GET",
        "server.address": "forecastservice",
        "url.full": "https://forecastservice/weatherforecast/GetForecastForUser",
        "network.protocol.version": "1.1",
        "http.response.status_code": 500,
        "error.type": "500",
        "operation.name": "system.net.http.client"
      },
      "events": [],
      "child_spans": [
        {
          "operation_name": "GET WeatherForecast/GetForecastForUser",
          "client_or_server": "server",
          "duration_ms": 593.5335,
          "service_name": "ForecastService",
          "service_version": "1.0.0.0",
          "attributes": {
            "server.address": "forecastservice",
            "http.request.method": "GET",
            "url.scheme": "https",
            "url.path": "/weatherforecast/GetForecastForUser",
            "network.protocol.version": "1.1",
            "user.country": "Singapore",
            "forecast.temperatureC": 30,
            "error.type": "System.Collections.Generic.KeyNotFoundException",
            "http.route": "WeatherForecast/GetForecastForUser",
            "http.response.status_code": 500,
            "operation.name": "microsoft.aspnetcore.server"
          },
          "events": [
            {
              "type": "exception",
              "attributes": {
                "exception.type": "System.Collections.Generic.KeyNotFoundException",
                "exception.stacktrace": "System.Collections.Generic.KeyNotFoundException: The given key '30' was not present in the dictionary.\\n   at System.Collections.Generic.Dictionary`2.get_Item(TKey key)\\n   at ForecastService.Controllers.ForecastProvider.GetSummary(Int32 temp) in C:\\\\Users\\\\Blake\\\\source\\\\repos\\\\OpenTelemetry-Demo\\\\src\\\\ForecastService\\\\Controllers\\\\WeatherForecastController.cs:line 77\\n   at ForecastService.Controllers.ForecastProvider.Get(User user) in C:\\\\Users\\\\Blake\\\\source\\\\repos\\\\OpenTelemetry-Demo\\\\src\\\\ForecastService\\\\Controllers\\\\WeatherForecastController.cs:line 41\\n   at ForecastService.Controllers.WeatherForecastController.Get(User user) in C:\\\\Users\\\\Blake\\\\source\\\\repos\\\\OpenTelemetry-Demo\\\\src\\\\ForecastService\\\\Controllers\\\\WeatherForecastController.cs:line 13\\n   at lambda_method64(Closure, Object)\\n   at Microsoft.AspNetCore.Mvc.Infrastructure.ActionMethodExecutor.AwaitableObjectResultExecutor.Execute(ActionContext actionContext, IActionResultTypeMapper mapper, ObjectMethodExecutor executor, Object controller, Object[] arguments)\\n   at Microsoft.AspNetCore.Mvc.Infrastructure.ControllerActionInvoker.<InvokeActionMethodAsync>g__Logged|12_1(ControllerActionInvoker invoker)\\n   at Microsoft.AspNetCore.Mvc.Infrastructure.ControllerActionInvoker.<InvokeNextActionFilterAsync>g__Awaited|10_0(ControllerActionInvoker invoker, Task lastTask, State next, Scope scope, Object state, Boolean isCompleted)\\n   at Microsoft.AspNetCore.Mvc.Infrastructure.ControllerActionInvoker.Rethrow(ActionExecutedContextSealed context)\\n   at Microsoft.AspNetCore.Mvc.Infrastructure.ControllerActionInvoker.Next(State& next, Scope& scope, Object& state, Boolean& isCompleted)\\n   at Microsoft.AspNetCore.Mvc.Infrastructure.ControllerActionInvoker.<InvokeInnerFilterAsync>g__Awaited|13_0(ControllerActionInvoker invoker, Task lastTask, State next, Scope scope, Object state, Boolean isCompleted)\\n   at Microsoft.AspNetCore.Mvc.Infrastructure.ResourceInvoker.<InvokeFilterPipelineAsync>g__Awaited|20_0(ResourceInvoker invoker, Task lastTask, State next, Scope scope, Object state, Boolean isCompleted)\\n   at Microsoft.AspNetCore.Mvc.Infrastructure.ResourceInvoker.<InvokeAsync>g__Logged|17_1(ResourceInvoker invoker)\\n   at Microsoft.AspNetCore.Mvc.Infrastructure.ResourceInvoker.<InvokeAsync>g__Logged|17_1(ResourceInvoker invoker)\\n   at Microsoft.AspNetCore.Builder.UseMiddlewareExtensions.InterfaceMiddlewareBinder.<>c__DisplayClass2_0.<<CreateMiddleware>b__0>d.MoveNext()\\n--- End of stack trace from previous location ---\\n   at Microsoft.AspNetCore.Authorization.AuthorizationMiddleware.Invoke(HttpContext context)\\n   at Swashbuckle.AspNetCore.SwaggerUI.SwaggerUIMiddleware.Invoke(HttpContext httpContext)\\n   at Swashbuckle.AspNetCore.Swagger.SwaggerMiddleware.Invoke(HttpContext httpContext, ISwaggerProvider swaggerProvider)\\n   at Microsoft.AspNetCore.Authentication.AuthenticationMiddleware.Invoke(HttpContext context)\\n   at Microsoft.AspNetCore.Diagnostics.DeveloperExceptionPageMiddlewareImpl.Invoke(HttpContext context)",
                "exception.message": "The given key '30' was not present in the dictionary."
              }
            }
          ],
          "child_spans": []
        }
      ]
    }
  ]
}
There’s too much code to post it in full, but I’ll pull out the relevant snippets. You can follow along fully in Github.
The key part of our data loading and preparation step is actually generating the embeddings. At this point in the code we’ve already read our profobuf files, converted them into our own python data model and stored the results in the traces array. The next step is to call the embeddings endpoint, specifying the model we want to use (text-embedding-ada-002). There are three embedding models available if you call OpenAI directly, but only one in Azure OpenAI. One of the main differences between embedding models is the length of the vector they return. Larger embedding vectors can model more dimensions, in other words, they may be able to capture more “meaning” (features and relationships) from the source text. By default, the size of the text-embedding-ada-002 vector is 1536 (meaning 1536 dimensions).
from openai import AzureOpenAI

client = AzureOpenAI(
  api_key = "secret-key",
  api_version = "2023-05-15",
  azure_endpoint = "https://blake-openai.openai.azure.com/"
)

points = []
for (i, trace) in enumerate(traces):
  # Generate embeddings
  response = client.embeddings.create(
    input = trace.to_json(),
    model = "text-embedding-ada-002"
  )
  vector = response.data[0].embedding

  # Add labels to the payload for analysis later.
  payload = {
    'duration': t.root_span.duration_ms,
    'http.response.status_code': t.root_span.attributes['http.response.status_code']
    # ...
  }

  points.append(PointStruct(id=id, vector=vector, payload=payload))

# Once we have all the points, insert them into our qdrant vector database.
operation_info = q_client.upsert(
  collection_name=col_name,
  wait=True,
  points=points
)
Anomaly Analysis
To identify anomalies, we use our qdrant vector database to calculate the similarity score between each trace in our anomaly dataset and the closest baseline trace. Scores closer to 1 indicate higher similarity than lower scores. For this exercise, we’re primarily interested in the distribution of scores for each of the anomaly datasets, so we’ll visualise them using a Jupyter notebook and the Seaborn library.
The function below loads our anomaly datasets and calculates the max_similarity score for each trace, by taking the similarity score from the closest trace in the baseline dataset. In a real system we might aggregate the scores for the top n closest traces, but we’ll keep it simple here.
# Calculate the similarity between the anomaly datasets and the baseline data.
# Each dataset will be loaded into its own Pandas dataframe.

import pandas as pd
from qdrant_client import QdrantClient

def load_collection(col_name, error_type_ids, with_similarity=True):
  # Fetch all points (traces) from collection
  q_client = QdrantClient("localhost", port=6333)
  live_points = q_client.scroll(collection_name=col_name, limit=1000, with_vectors=True)

  # Get similarity to baseline for each trace in the anomaly dataset
  baseline_col_name = "baseline"
  data = []
  for p in live_points[0]:
    search_result = q_client.search(
      collection_name=baseline_col_name,
      query_vector=p.vector,
      limit=10
    )
    data.append({
      'anomaly': col_name,
      'max_similarity': max([s.score for s in search_result]),
      'country': p.payload['country'],
      # load more labels...
    })

  return pd.DataFrame.from_records(data)
Anomaly: Finding new users
Our first anomaly is the addition of a new user, flagged via the user.country span attribute. We’ll start by plotting a histogram of max_similarity scores for each trace in the new user dataset.
sns.histplot(live_brazil_df, x='max_similarity', hue="country")
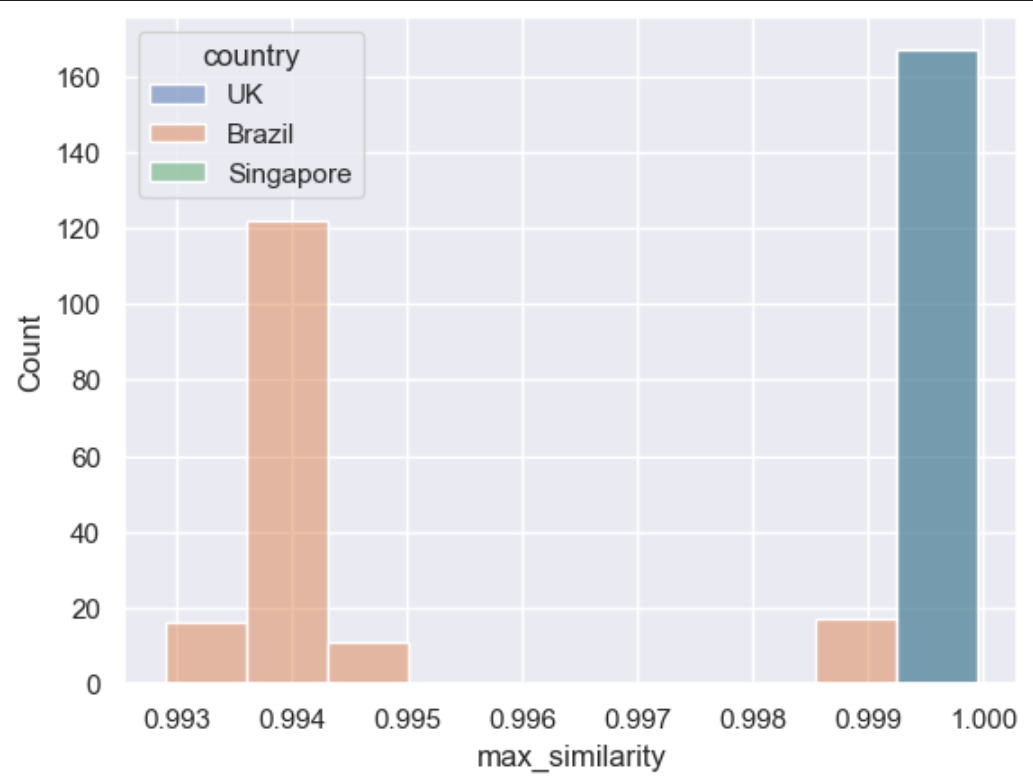
We can easily see the scores for requests from the UK and Singapore have a high similarity score compared to the new requests from Brazil, which is what we expect. Oddly, there is a small subset of the Brazil requests that have a higher similarity score. Let’s use a pairplot to discover which variable is causing the higher scores:
sns.pairplot(live_brazil_df[live_brazil_df['country'] == "Brazil"], vars=['max_similarity', 'http_res_status_code', 'forecast_temperature_c'])
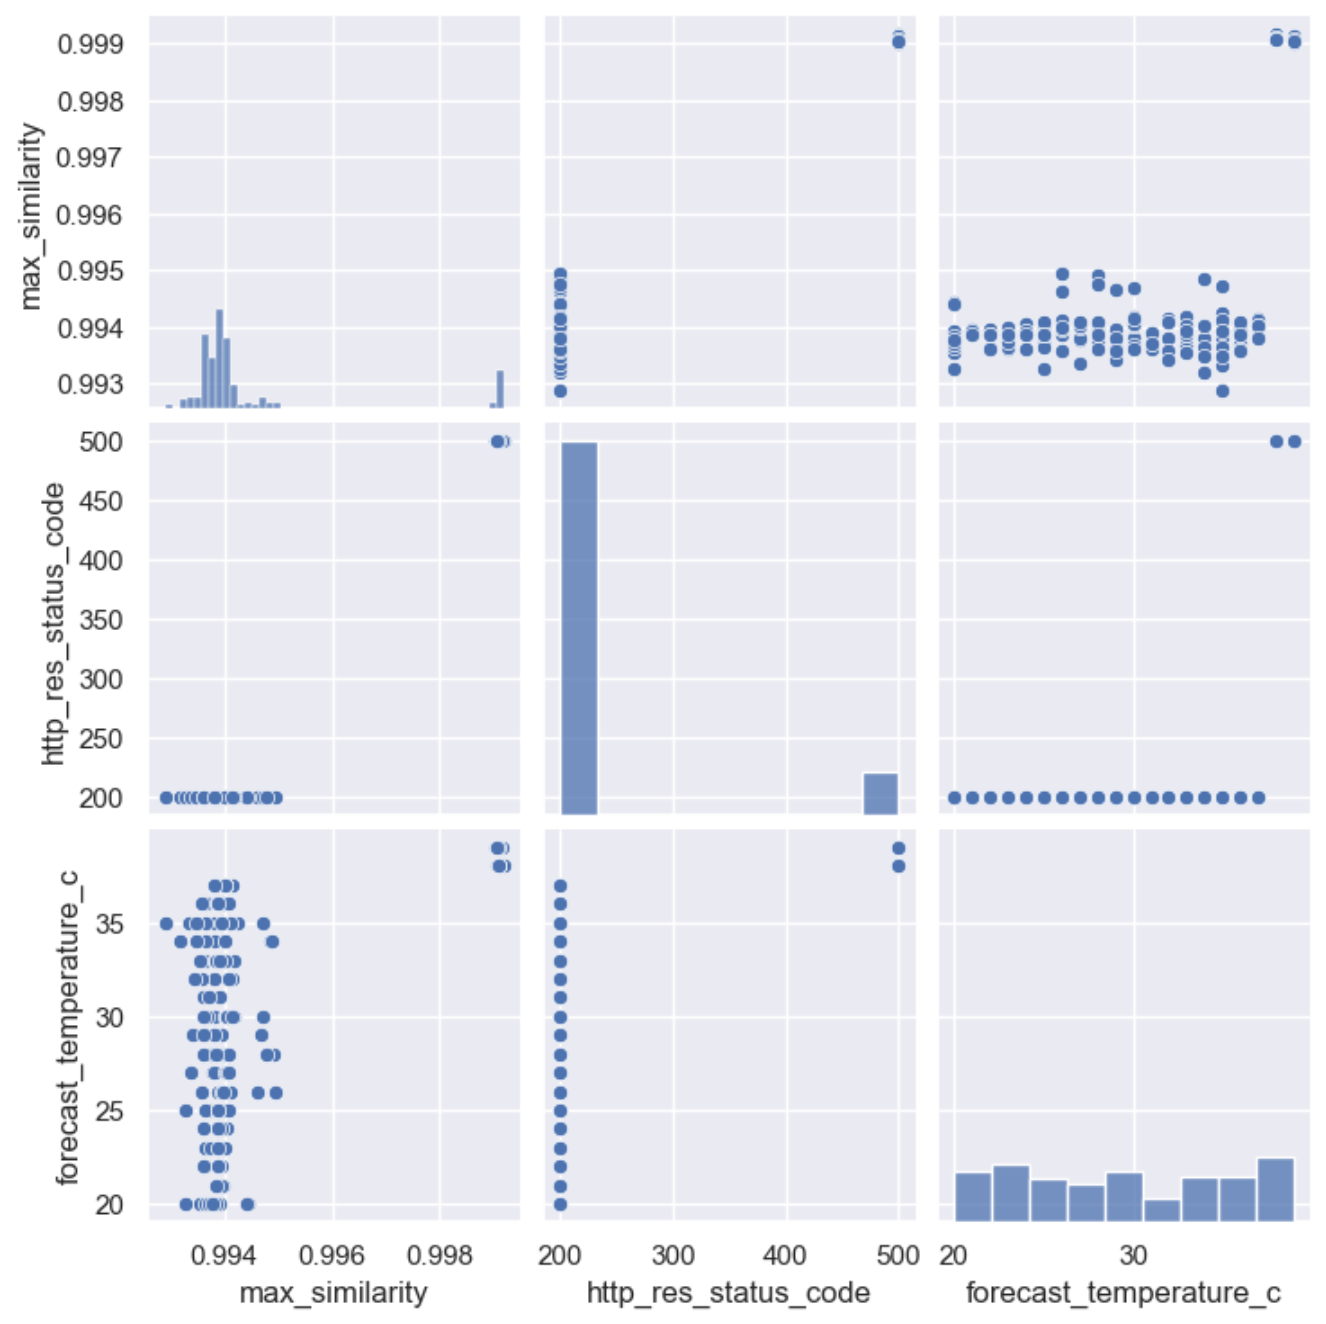
Starting with the bottom left hand corner, we can see a relationship between forecast_temperature_c and max_similarity, and if we analyse the next chart up (middle left) we can see the traces with http_res_status_code == 500 have the much higher similarity score. This explains the relationship between forecast_temperature_c and max_similarity, as all requests with a forecast temperature >= 38 throw a KeyNotFoundException. But why does this cause a higher similarity score? My theory here is the minor change of the user.country attribute had a lower weighting on requests with an exception, due to the much larger size of the overall text. In other words, a minor change in a small bit of text is noticeable, whereas a minor change in a large sea of text is not.
Anomaly: High UK request latency
In this anomaly, we’ve introduced additional latency for UK requests. To provide some context, we’ll start with a simple chart comparing the durations between the baseline and the anomaly dataset.
# Create two new dataframes from the baseline and live_high_uk_latency_df, filtering out any non-UK requests, then combine them.
combined_latency = pd.concat([baseline_uk, high_latency_uk])
sns.catplot(combined_latency, x='dataset', y='duration_ms')
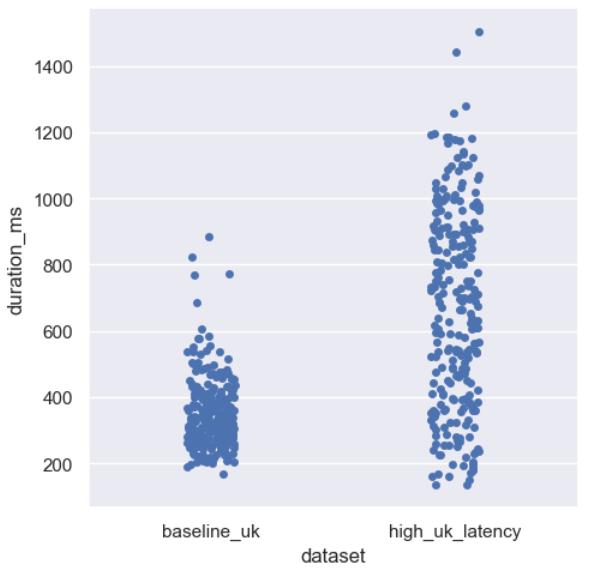
The durations for the anomaly dataset have a much higher range than the baseline dataset, so how does this translate into similarity scores?
sns.histplot(live_high_uk_latency_df, x='max_similarity', hue='country')
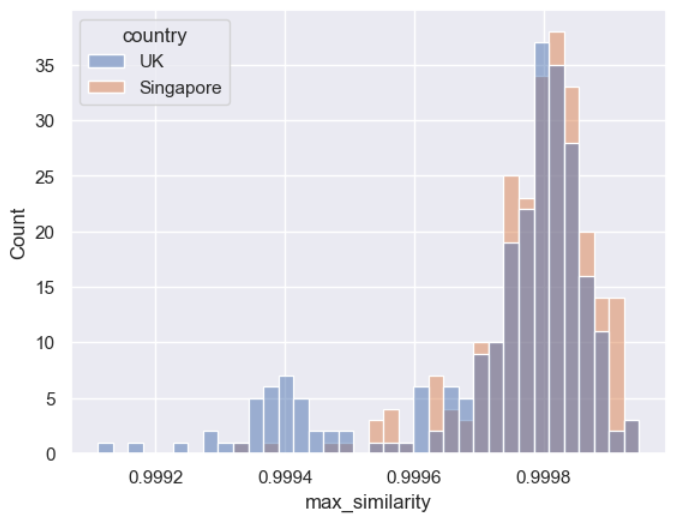
I’ve included the scores for the Singapore requests, which had no additional latency compared to the baseline, to help with comparison. The shape of the UK histogram largely follows that of the Singapore histogram, indicating those scores are well within the range we’d consider ‘normal’, although the UK histogram does have a larger tail. This is also backed up by the range of scores, for context, the range for our previous anomaly was 0.993 to 1.0, but for this anomaly the scores are all within 0.001 of each other.
Now I’m not saying embeddings are entirely useless at identifying anomalies across a continuous numerical data point, but it’s clear they aren’t as good at this as they are spotting differences in text. That makes sense when you consider the embedding model treats these values as discrete tokens; it doesn’t understand continuous values within a range. Whilst I haven’t done it here, I think we’d get much better results by converting the actual duration values into a discrete set of “duration buckets”.
Anomaly: Unseen exception type
The anomalies we’ve looked at so far involve spotting small changes within the span attributes, this anomaly should be a bit more obvious. We’re throwing a brand new InvalidOperationException for 10% of all requests that hit the ForecastService, so those traces contain new values for exception.type, exception.message, and exception.stacktrace.
Again, we’ll start with a distribution of similarity scores, this time split by http status code:
sns.histplot(live_unseen_exception_type_df, x='max_similarity', hue='http_res_status_code', bins=50, palette='bright')
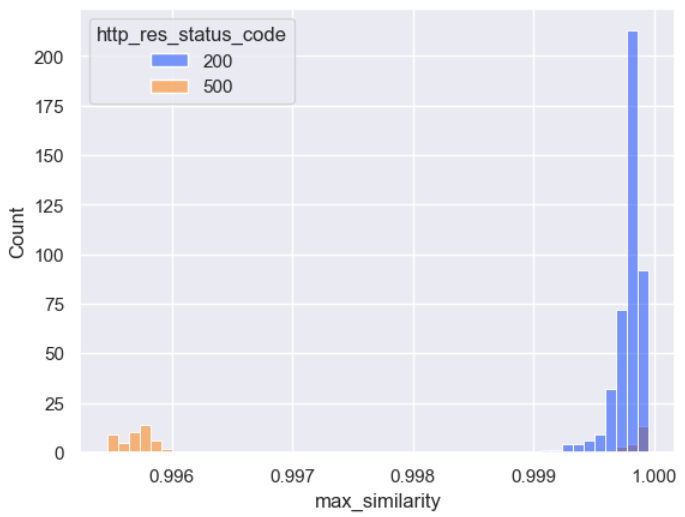
Whilst the split of scores is expected, what’s interesting again is the range: the minimum score (0.996) is larger than the minimum score for the new user anomaly dataset (0.993), even though the amount of “unseen text” in this dataset is considerably larger. We’ll explore these differences in a future post, for now let’s focus on the scores of the failed requests and split them by excpetion_type_id.
errors_df=live_unseen_exception_type_df[live_unseen_exception_type_df['http_res_status_code'] == 500]
sns.histplot(errors_df, x='max_similarity', hue='error_type_id', bins=50, palette='bright')
Key: {'System.Collections.Generic.KeyNotFoundException': 0, 'System.InvalidOperationException': 1}
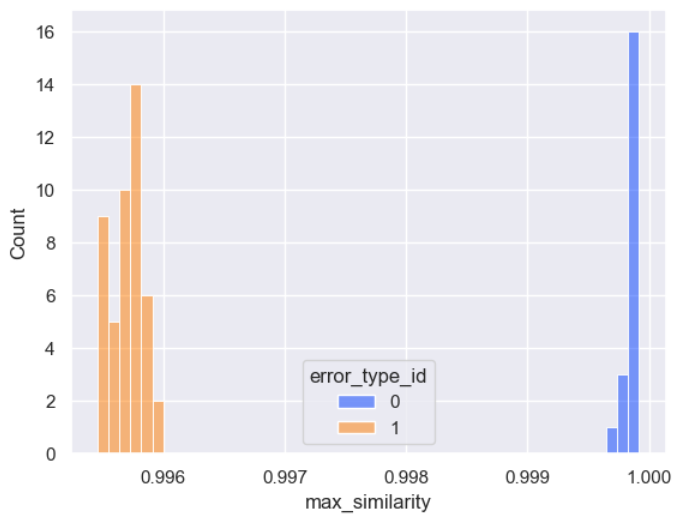
Just as we expected, the scores for our new exception type (id == 1), are lower than the scores for our existing exception type (id == 0).
Conclusion
I believe we’ve demonstrated that embeddings based approaches to anomaly detection work. We saw clear clusters between our anomalous and baseline traces, but in the real world observability systems are heavily metric driven, and as we’ve seen, this approach doesn’t lend itself well to continuous data points. A better use-case within the realm of observability might be detecting anomalies within logs. This was still a great exercise to improve my understanding and pick up the general ideas behind embeddings, and to see what works well and what doesn’t.
If I were to repeat this exercise again, there are a few things I’d do differently.
First would be spending more time on data cleanliness. We saw with the new user anomaly that traces with exceptions had higher similarity scores than traces without, as the exception seemed to “drown out” the anomaly values. Since embeddings are generated on unstructured text, it’s tempting to just throw all the data at the model at rely on it spotting the differences. The embedding model isn’t playing spot-the-difference, rather than drawing two pictures that are 99% the same, you need to find a way to draw an entirely different picture. That means removing all static values, or values that aren’t helpful in spotting an anomaly.
I also think it would be an interesting experiment to try generating embeddings per span, and then comparing those embeddings to baseline spans with the same set of labels (service, operation, country, etc). By reducing the amount of text per embedding, smaller changes in the data, such as changes in single attributes, should result in much lower similarity scores. Combining this with improved data cleanliness should really improve performance. This would also help us capture anomalies within smaller subgroups, where the anomalous values might be considered normal within a different group. The high durations for UK requests are a perfect example of this, those high UK durations would be considered normal for Singapore.
